Augmented Reality App Cost Explained for UK Businesses
A simple 3D product viewer in the UK typically costs £2,000, £8,000, an interactive AR experience £8,000, £25,000, a full AR marketing campaign £20,000, £60,000, and a complex custom AR application £50,000, £120,000+. The final augmented reality app cost depends less on the label “AR” than on scope, platform choice, content, timeline and maintenance. You may be weighing an interactive product demonstration against a conventional campaign budget, or asking whether a browser experience could achieve the same result as a downloadable app. Then a supplier sends a range that seems unusually wide. That uncertainty is understandable because “AR app” can describe anything from a single model triggered by a printed image to a connected, multi-platform product with live data and spatial tracking. A sensible budget starts with the experience you need users to have, not the technology you want to mention in a pitch. The sections below separate the major cost layers, compare UK build routes and show how to reduce waste without stripping out the part that makes the experience useful.
Why Augmented Reality App Cost Varies So Much
A retailer may want shoppers to place a product in their homes before buying. An exhibition team may want visitors to scan a display and reveal an animated explanation. A training provider may need a spatial simulation that records decisions and reports results. Each is an AR project, yet the production work, platform requirements and budget can differ sharply. The UK pricing ladder shows the range. A simple 3D product viewer generally costs £2,000 to £8,000, while an interactive AR experience is typically £8,000, £25,000. A full AR marketing campaign often sits at £20,000, £60,000, and a complex custom AR application can reach £50,000, £120,000+, according to the UK AR and WebAR project pricing guide. These bands are landmarks, not fixed tariffs. A product viewer may need one prepared model, basic placement and a short user journey. A campaign could require several assets, animation, content management, analytics and launch support. A custom application may add accounts, backend services, device support, advanced tracking and ongoing updates.
AR is a production spectrum
The phrase “AR app” conceals several decisions that shape the quote:
- •Reach: Will the audience scan a QR code in a browser, download an app or use dedicated hardware?
- •Tracking: Must the experience recognise a printed marker, detect surfaces, understand location or coordinate several users?
- •Content: Are existing product models ready for use, or must artists build and animate them from scratch?
- •Integration: Will the experience stand alone, or connect with e-commerce, a CMS, analytics or internal systems?
- •Longevity: Is it a short campaign, a permanent sales tool or a product that must handle platform changes?
Platform choice is a decision ladder. WebAR can suit a short campaign with a broad audience because users can start in the browser. Native development may justify its added work when performance, device access or complex interactions matter. Unity can provide a practical middle route when one experience needs to run across supported platforms. The most useful first brief states the audience, campaign duration and one action users must complete. Those choices narrow the budget faster than a long feature list, while leaving room to decide whether the experience needs WebAR, Unity or a native build.
Understanding What You Are Actually Paying For in an AR App
An AR experience is easier to budget when you treat it as several connected layers rather than one block of software. Think of a theatre production. The application is the venue and control system, but the actors, set, lighting, sound, rehearsal and ticketing process still require separate work. The first layer is tracking. Marker-based AR uses a known image or object as an anchor. Surface-tracked AR finds floors, tables or walls through the camera and device sensors. Location-based AR uses position and direction to decide when and where content appears. More demanding tracking increases testing because the team must check lighting, surfaces, movement and device behaviour. The second layer is content. A basic 3D model may need cleaning and optimisation before it runs smoothly on a phone. A hero asset may need new geometry, materials, rigging, animation, sound and alternate versions for different devices. Coding doesn't replace that work. It coordinates the content.
Five layers buyers should separate
- Experience logic controls what happens after a user scans, taps, moves or completes an action.
- 3D and 2D production supplies the models, materials, animation, video, graphics and sound.
- Interaction design makes the experience understandable, including prompts, onboarding and accessibility choices.
- Services and integrations connect product data, e-commerce, analytics, content management or authentication.
- Optimisation and support keep the experience stable across supported devices and operating-system updates.
Key Factors That Drive Augmented Reality App Cost
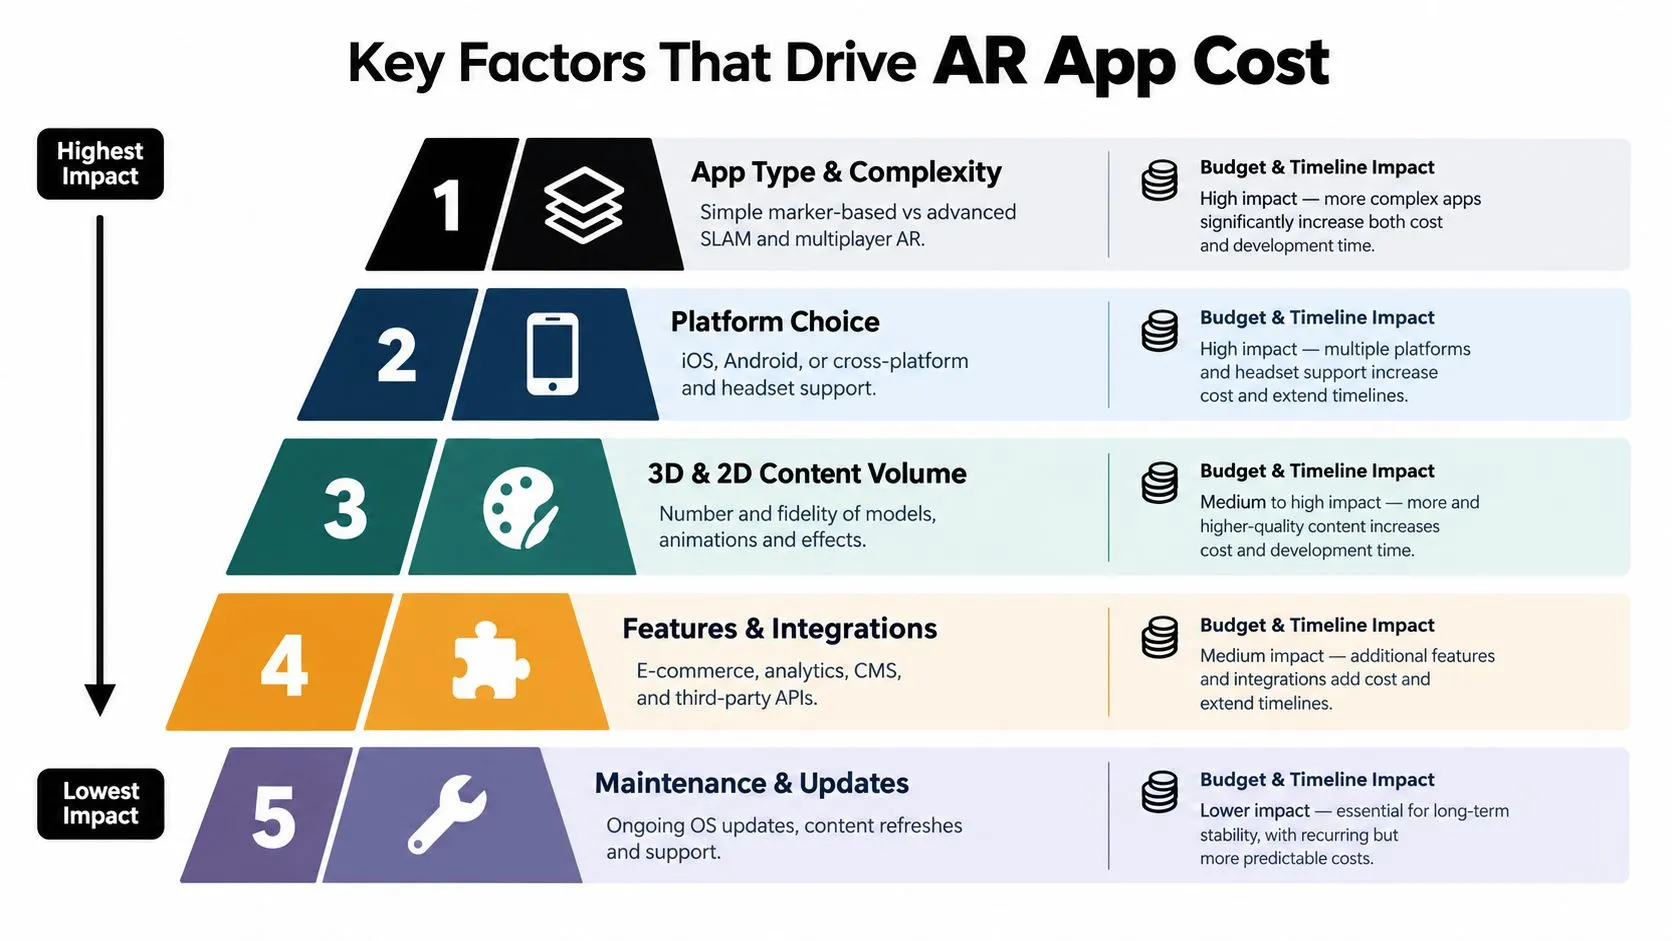
The largest budget changes usually come from a handful of decisions made early. A short brief can look simple until each sentence becomes a production task. App type and spatial complexity come first. A marker-triggered animation has a defined starting point. A markerless experience must understand a user's surroundings and place content convincingly. A location-based or shared experience adds position, state management and more demanding real-world testing. Multiplayer AR introduces coordination between users, which changes both the technical architecture and the QA plan. Platform choice affects the work in two ways. The team must build for the selected environment, then test its behaviour across the devices the audience uses. An iOS-only experience has a narrower device matrix than a product intended for both iOS and Android, while headset support brings another interaction model and performance target.Content can outweigh code
A single product model might be supplied by the client, but it still needs checking for polygon density, textures, scale and lighting. If the brief adds several products, animated components, custom characters or visual effects, the content department becomes a substantial part of the project. UK animation benchmarks show the same escalation. A 60-second motion graphics project typically costs £3,000, £6,000, while 2D animation is commonly £4,000, £8,000, 2D character animation £6,000, £12,000, and 3D animation £6,000, £20,000+, based on this UK animation pricing guide. Those figures aren't AR app quotes, but they help explain why a 3D-heavy experience can move beyond a light overlay budget.Features create secondary work
A product configurator isn't only a 3D viewer. It may need variant logic, asset loading, pricing information, content updates and error handling. Analytics requires event definitions, implementation and validation. A CMS needs permissions, content formats and publishing workflows. QA also expands with every promise in the brief. The team must test tracking, loading, interactions, orientation, permissions, interrupted sessions and device performance. A polished demonstration that fails in poor lighting or on a common phone can create more commercial damage than a simpler experience that works reliably. Finally, team composition matters. A producer, UX designer, 3D artist, technical artist, developer and QA specialist may each contribute at different stages. A lean team can be efficient, but one person shouldn't be expected to solve every creative, technical and compliance problem without affecting the timeline.Choosing Your Build Approach and Platform Mix
A UK retailer planning a QR campaign may need only a browser experience, while a product team building an interactive mobile tool may need Unity or native development. The platform decision is therefore a scope ladder. Each step adds control, testing and maintenance, rather than increasing the app's price.| Build Approach | Typical UK Cost Band | Typical Timeline | Best For |
|---|---|---|---|
| Browser-based WebAR | £2,000, £60,000 | 2, 4 weeks | Short campaigns, QR-led access and broad reach |
| Unity cross-platform AR app | £15,000, £60,000 | 4, 8 months | Shared product logic across supported platforms |
| Fully native ARKit plus ARCore | £40,000, £80,000+ | 4, 8 months | High-performance mobile experiences and platform-specific control |
WebAR
WebAR removes the app-store download from the first interaction. That suits exhibitions, packaging, paid media and time-limited campaigns, especially when a QR code should take people directly to the experience. Browser permissions, device compatibility and performance still require careful handling, particularly with heavy 3D content. The WebAR guide for UK business use cases can help a team assess whether browser access fits its audience journey and campaign conditions.Unity cross-platform
Unity can reduce duplicated feature work when the experience must run consistently across supported mobile platforms or devices. It suits interactive content and game-like mechanics, but the team still needs device testing, deployment preparation and optimisation. Cross-platform is a shared foundation, not a promise that every device behaves identically.Native development
Native ARKit and ARCore development gives specialists more direct control over each mobile environment. That can suit demanding performance requirements or platform-specific capabilities. Separate implementation and testing effort may raise the budget, so choose native development when the required control justifies the additional work, rather than treating it as a premium label.Timelines Team Roles and Hidden Delivery Costs
A credible AR schedule follows the work, not just the software build. The team first turns the idea into a user journey, then proves the visual and technical direction, creates the content, builds the interaction and tests the result under real conditions. UK guidance places WebAR delivery at 2, 4 weeks, while native and Unity-based projects often take 4, 8 months, as outlined in the platform benchmark cited earlier. That gap reflects more than coding. Longer projects usually include more assets, more devices, more integration and more review cycles.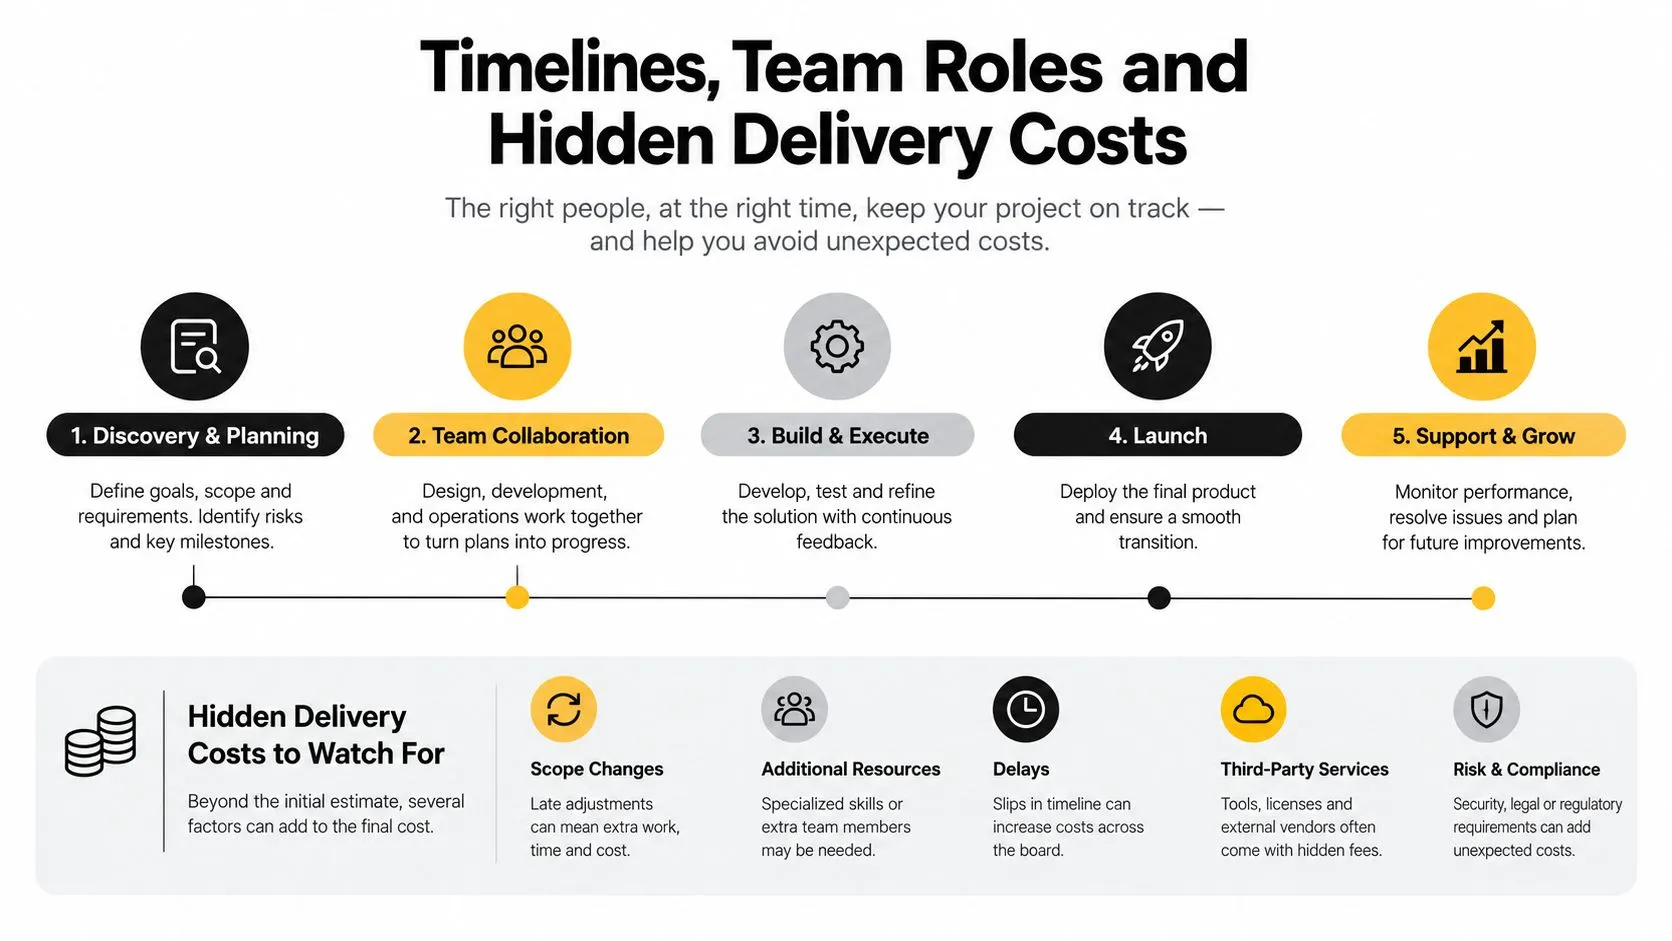
The people behind the estimate
A typical workflow may involve:- •Producer or project manager: Owns scope, dependencies, approvals and delivery risk.
- •UX and interaction designer: Defines onboarding, controls, feedback and user flow.
- •3D artist and technical artist: Build or adapt models, materials, animation and efficient runtime assets.
- •Unity or native developer: Implements tracking, interactions, services and deployment.
- •QA specialist: Tests supported devices, environments, edge cases and release builds.
The team doesn't always work at full capacity throughout the project. Artists may lead during asset production, while developers take over as the experience becomes interactive. Clear handoffs prevent expensive rework.
Costs that hide in the gaps
Buyers often budget for the first build and forget the surrounding work. Device procurement or access, app-store preparation, analytics configuration, content uploads, stakeholder review and on-site support can all affect delivery. Maintenance also matters. Operating-system changes, browser behaviour, device compatibility and refreshed campaign content can require future work even when the original experience hasn't changed. A production plan should therefore identify what the quoted budget includes, what counts as a change request and who owns the final assets. UK Clutch data places most UK-based VR and AR companies at £60, £120+ per hour, with prototype budgets around £15,000, £50,000, pilots or MVPs around £40,000, £150,000, and enterprise programmes at £100,000, £500,000+. These benchmarks are available in Clutch's UK VR and AR company pricing data.
Example Budgets and Real World AR Scenarios
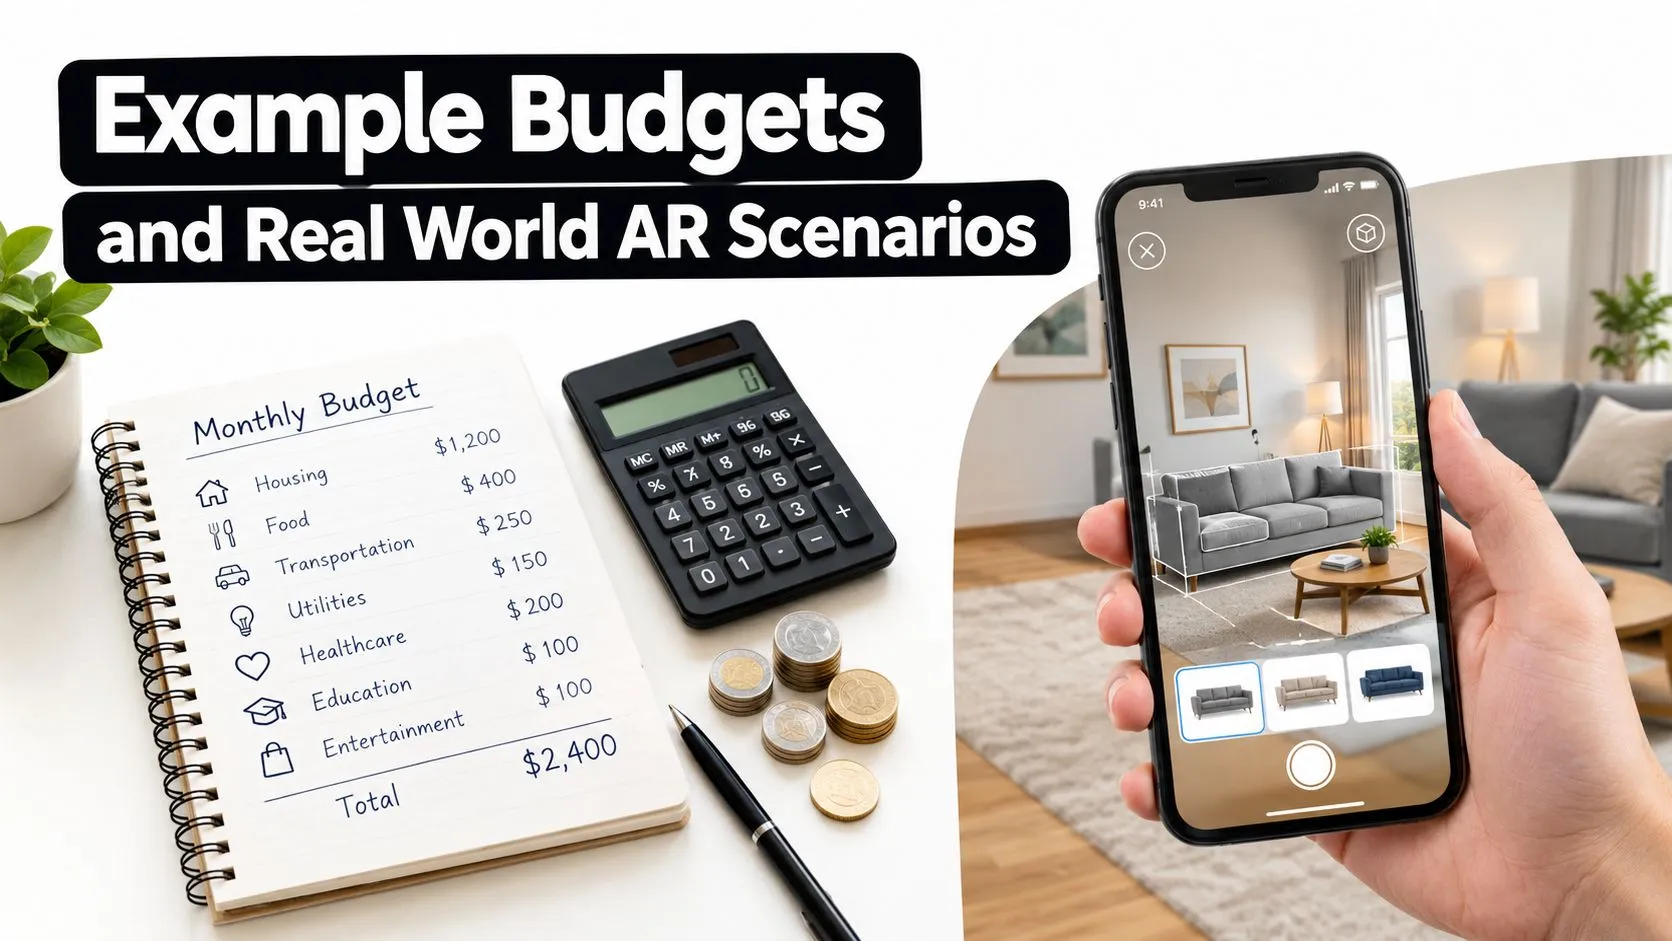
A useful way to test your budget is to describe the experience without naming the technology. “Users scan a product and rotate it” is a much clearer starting point than “we need an AR app”. Consider a furniture viewer. The customer scans a QR code, opens a browser, places one prepared model and changes its position or scale. That sits naturally near the £2,000, £8,000 UK benchmark for a simple 3D product viewer, provided the content is ready and the interaction remains focused. If the project needs several products, custom animations, product variants and analytics, it moves into a different scope.
Three practical scenarios
Retail configurator: A shopper places a product, switches colours or components and follows a route to purchase. The budget depends on the number of variants, the source of product data, the e-commerce connection and the amount of custom 3D work. It will usually demand more than a static viewer because every option needs testing. Exhibition activation: Visitors scan printed material and reveal a short animated explanation or interactive model. A browser route can suit a temporary stand, particularly when download friction would reduce participation. Physical conditions matter, so the production plan should include lighting, signage, connectivity and staff guidance. Training or entertainment experience: A location-based game or training simulation may include scoring, user state, content delivery, reporting and a controlled operating environment. That combination can push the project towards the £50,000, £120,000+ complex custom application band, depending on the final scope and platform.
Treat content as its own budget
Animation lead time helps explain why custom 3D AR takes longer than a 2D overlay. UK production guidance places 2D and motion-graphics animation at 4, 8 weeks, while 3D animation takes 8, 16 weeks, according to this UK animation production timeline guide. Freelance animation guidance also gives day-rate benchmarks of £180, £300 for junior work, £300, £500 for mid-level work and £500, £700+ for senior work in the UK, as described by UK freelance animation rate guidance. The question isn't whether 3D is expensive in isolation. It's whether the asset will be reused across sales, training, film, web and XR, and whether that reuse justifies its production effort.
How to Optimise Scope and Maximise ROI on Your AR Investment
Start with one user action that matters. A product viewer might aim to help a buyer understand scale. An exhibition experience might aim to turn a passive display into a guided conversation. A training simulation might aim to assess a specific decision. The narrower the first release, the easier it is to measure whether AR deserves further investment. Choose the lightest platform that can deliver that action reliably. WebAR can suit short campaigns and public-facing activations because users can enter through a browser. Unity can support a richer, reusable interactive product. Native development earns its place when device-specific performance or capability is essential.
Protect value while trimming waste
- •Reuse approved assets: Adapt existing models, animation and brand materials where their technical quality permits.
- •Phase features: Separate the core experience from accounts, social sharing, advanced analytics or CMS functionality.
- •Limit the first content set: Prove the interaction with a representative product or scenario before producing a full catalogue.
- •Plan maintenance early: Decide who updates content, checks supported devices and handles platform changes.
- •Measure the intended outcome: Track meaningful actions such as dwell time, product interaction, qualified enquiries, conversions or training decisions.
A UK market forecast projects augmented reality revenue in the UK to rise from USD 9,061.1 million in 2025 to USD 76,024.0 million by 2033, according to the UK augmented reality market outlook. That projection signals expanding commercial interest, but it doesn't make every AR brief financially sound. Your audience size, campaign duration, reuse potential and maintenance burden still determine whether the investment is justified. A practical overview of AR advantages, ROI, engagement and efficiency can help shape those measures before production begins. Studio Liddell can help scope AR applications, interactive 3D content and connected XR experiences around a defined audience and business outcome. Visit Studio Liddell to discuss your concept, platform options and a production route that gives your team a clearer budget before development starts.